Viewing graphs (Traffic/Load/Memory usage) in client area


  • Click "My Account" > "My Services"


 You will see your virtual private servers.

  • Click on any server from the list to get in administration area.

 
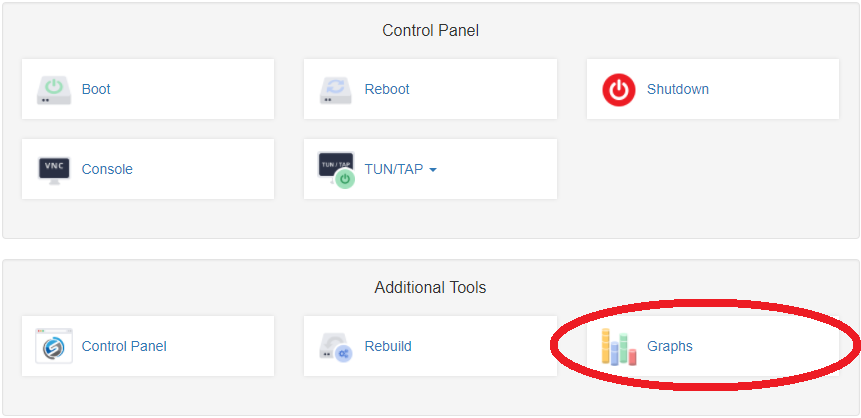
Press the "Graphs" button


You will see something like this:

Was this answer helpful?

 Print this Article

Also Read

Managing VPS with mobile device

SolusVM also provides mobile version of its control panel. The link is the same:...

How to reinstall OS at your VPS

You can reinstall OS on your VPS in few minutes. Please note that reinstalling OS will overwrite...

How to install a control panel on your VPS

How to install a control panel on your VPS We do not recommend installing on the same server...

VPS quick backup / snapshot in Virtualizor Panel

Virtualizor control panel has a Quick Backup feature wich allows you to take a snapshot of your...

How to change your root password

If you've lost or forgot your root password there are two simple ways to change it. But if you...